Most investors analyze balance sheets, profit margins, and price trends.
But one critical factor is often ignored:
Supply chain risk.
A company can appear financially strong — and still collapse due to operational disruptions.
🚨 The Hidden Risk Most Investors Miss
- Dependence on a single supplier
- Geopolitical exposure
- Lack of supply contracts
- Over-concentration in vendors
Traditional platforms do not quantify these risks in a structured way.
This system changes that.
⚙️ What This System Does
The Supply Chain tab converts raw supplier data into a quantified risk intelligence model.
It answers key questions:
- How fragile is the supply chain?
- How dependent is the company on key suppliers?
- How reliable is the available data?
🧱 1. Structural Risk (Single Point of Failure)
The system detects supply chain fragility using supplier tier distribution.
Fewer Tier-1 suppliers indicate higher dependency and risk.
This acts as a network resilience model.
Extreme cases (1–2 Tier 1 suppliers) are treated as high single-point-of-failure scenarios.
💰 2. Dependency Risk (Concentration Analysis)
Supplier concentration is measured using a weighted model similar to the Herfindahl-Hirschman Index (HHI).
If a few suppliers dominate:
- Risk increases significantly
- Negotiation power decreases
When data is missing, the system uses intelligent fallback weighting based on supplier tiers.
The model normalizes supplier dependency and applies concentration scoring similar to HHI, capturing real economic exposure.
👁️ 3. Visibility Risk (Data Transparency)
Not all risks come from known data.
The system evaluates how much of the supply chain is visible and contract-backed.
Less visibility means higher uncertainty — and higher risk.
⚠️ 4. Supplier-Level Risk Scoring
Each supplier is evaluated using a network-aware risk model:
- Tier importance (Tier 1 = highest operational impact)
- Geographic exposure (country-level risk factors)
- Contract availability (data visibility and reliability)
- Shock propagation score (how disruption spreads across the network)
- Network centrality (how critical the supplier is in the ecosystem)
This transforms supplier analysis from static scoring → to dynamic system-level risk modeling.
🧮 5. Composite Risk Score
The final risk score combines multiple factors:
- Structural risk
- Dependency concentration
- Visibility risk
The model also incorporates supplier-level risk contributions derived from network behavior, propagation dynamics, and critical node influence.
This ensures the final score reflects both structural fragility and real-world disruption impact.
📊 6. Confidence Score
The system quantifies how reliable the risk analysis is.
The confidence score is derived from:
- Availability of financial dependency data
- Contract visibility across suppliers
Higher data completeness leads to higher certainty.
This ensures users understand whether the risk score is data-driven or heuristic.
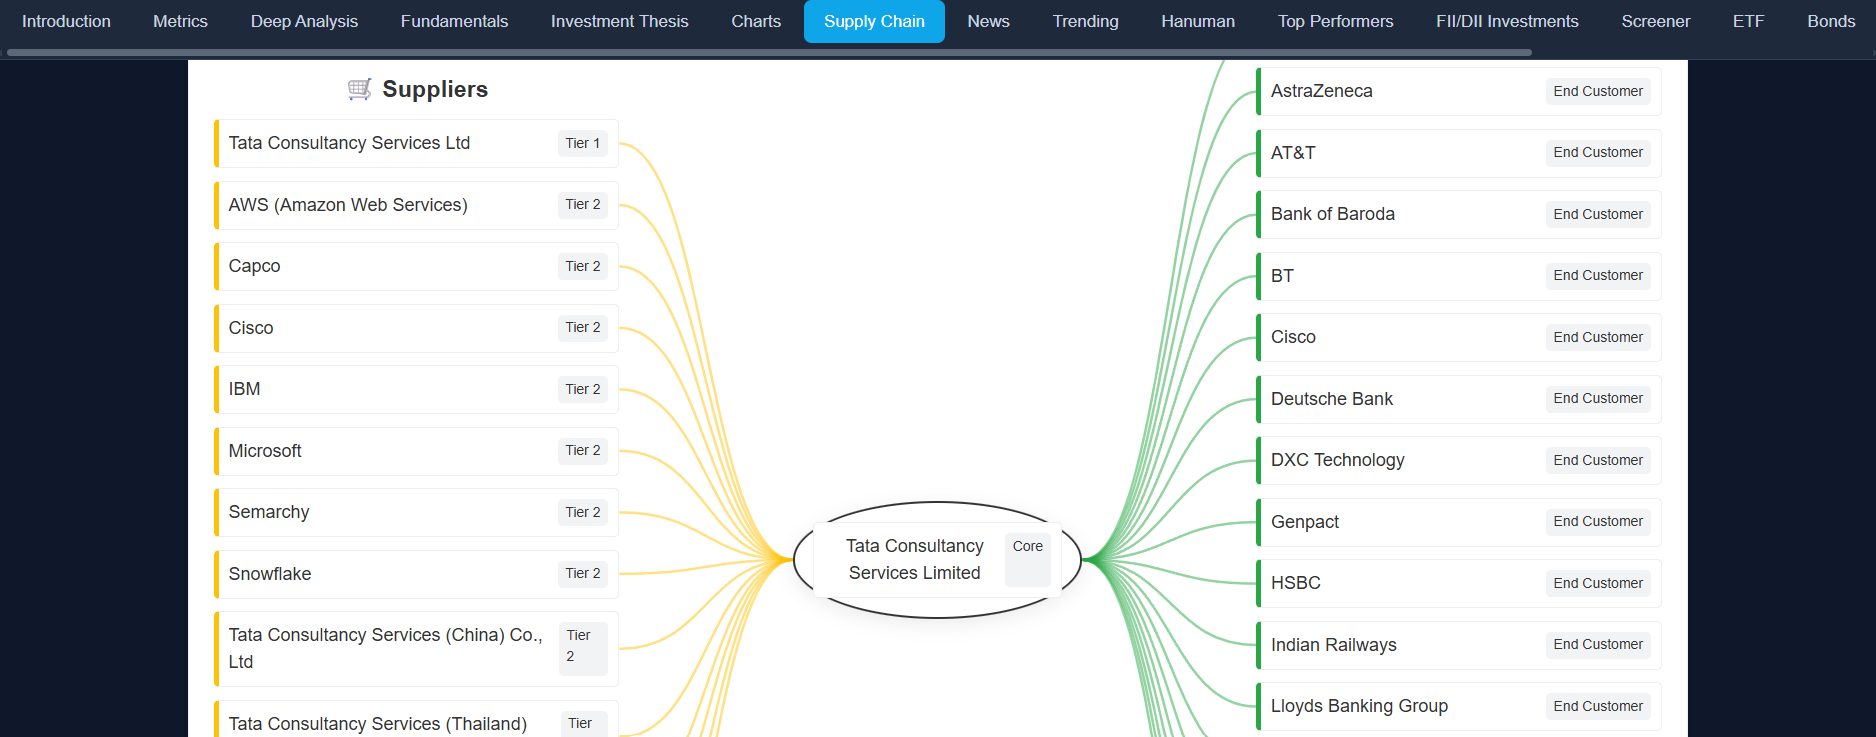
📈 7. Visual Intelligence Layer
Data is presented through intuitive visualizations:
- Risk gauge for instant understanding
- Risk vs dependency matrix
- Interactive supply chain network graph
This allows investors to quickly interpret complex relationships.
🧠 8. Network Intelligence & Shock Analysis
The system models the supply chain as a network — not just a list of suppliers.
- Identifies critical nodes that can disrupt the entire system
- Measures how shocks propagate across suppliers
- Detects hidden concentration through network centrality
This allows investors to simulate real-world disruption scenarios — not just static risk.
💡 Why This Matters
- Detect hidden operational risks early
- Avoid companies with fragile supply chains
- Understand real business resilience
- Make better long-term investment decisions
🌍 Hidden Exposure & Indirect Risk
Risk doesn’t always come from direct suppliers.
The system detects indirect exposure through high-risk geographies and supply chain links.
- Suppliers operating in high-risk regions
- Second-order dependencies (supplier’s suppliers)
- Indirect exposure not visible in financial reports
This uncovers risks that traditional analysis completely misses.
🚀 Real-World Use Cases
- Identify companies dependent on a single supplier
- Analyze global exposure risks
- Evaluate supply chain stability before investing
🚀 Final Takeaway
Financial data shows what a company has done.
Supply chain analysis shows what could break it.
👉 This is not just data — it is operational risk intelligence.