Stock 360s – AI-Powered Indian Stock Market Analytics
All your markets in one place—stocks, bonds, ETFs, and mutual funds with real-time, decision-grade insights. Check out our dashboard functions on our YouTube channel.

Everything You Need in One Dashboard
Powerful tools for investors, analysts, and research professionals.
AI Market radar
A contextual intelligence layer that connects today’s news with historical market behavior.
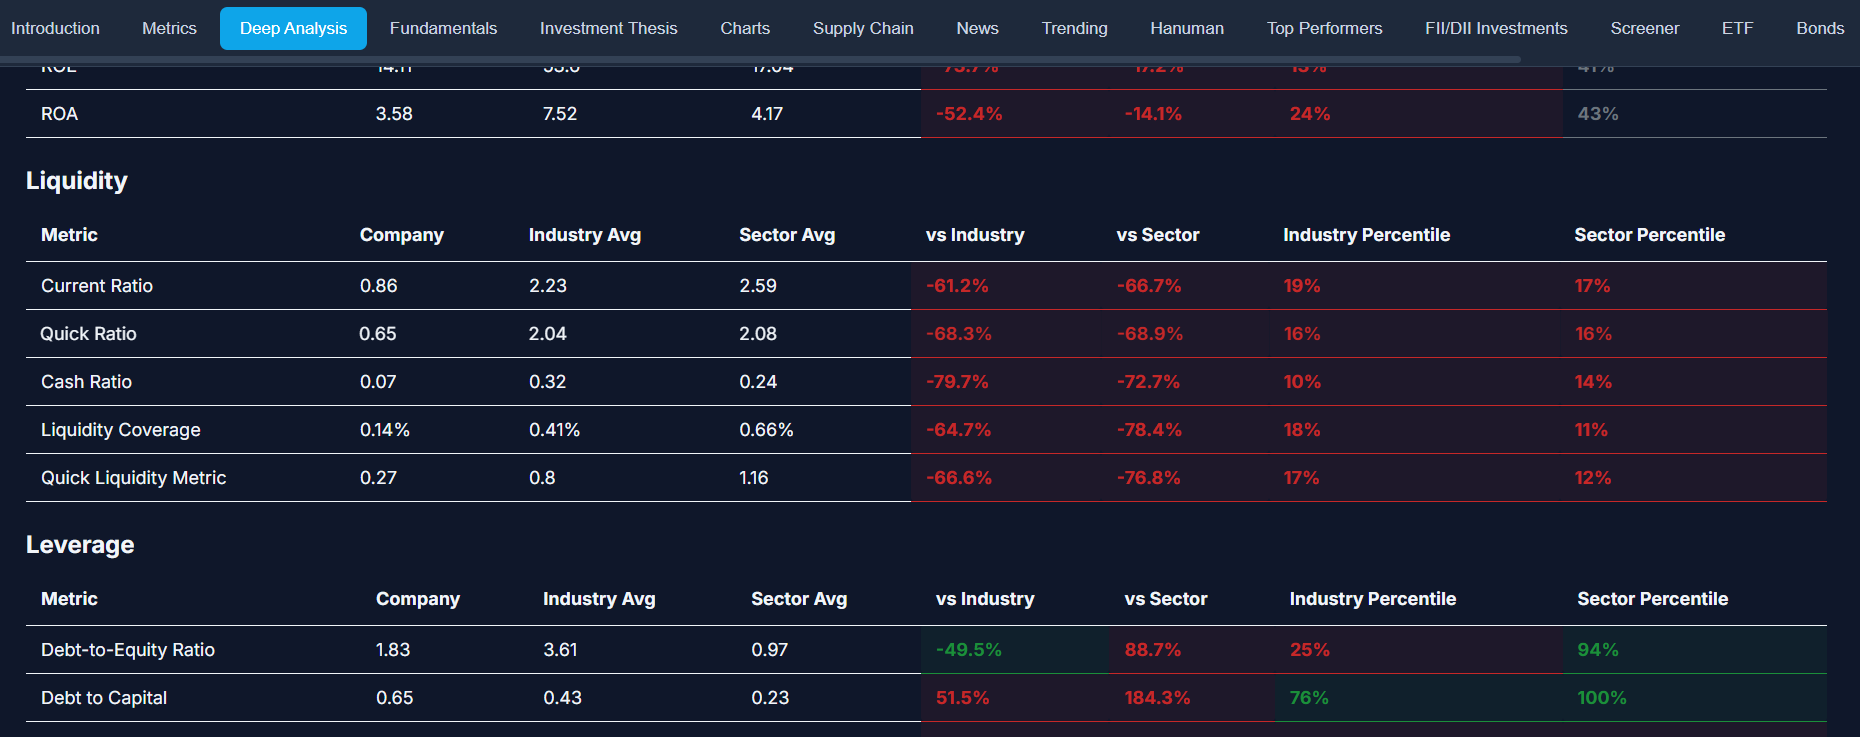
Deep Analysis
Turn raw financials into context with YoY, QoQ, peer benchmarks, and long-term valuation lenses. This is where numbers become understanding.
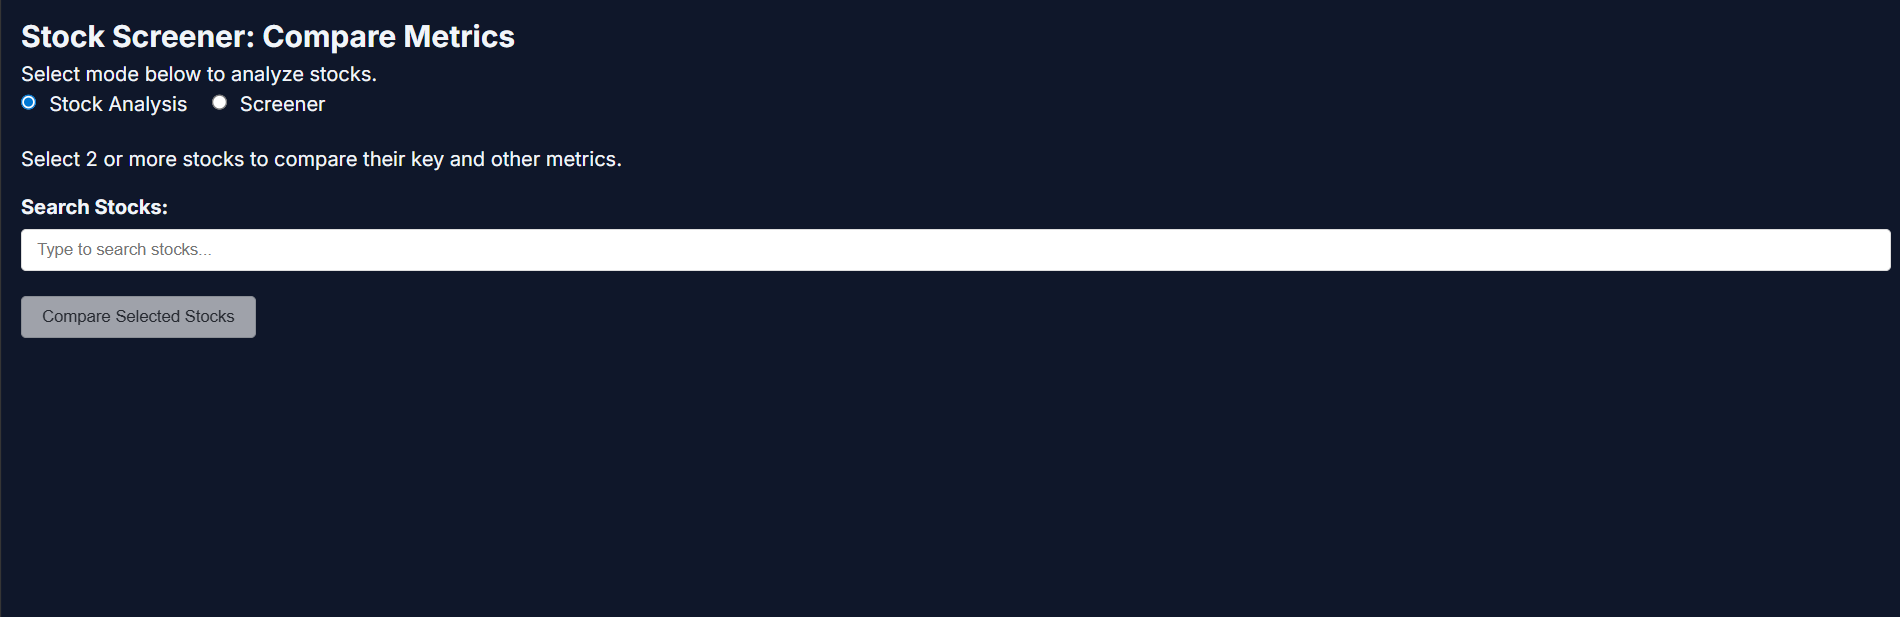
Screener
Filter thousands of stocks into a focused shortlist using custom financial logic. Precision tools for investors who know what they’re looking for.
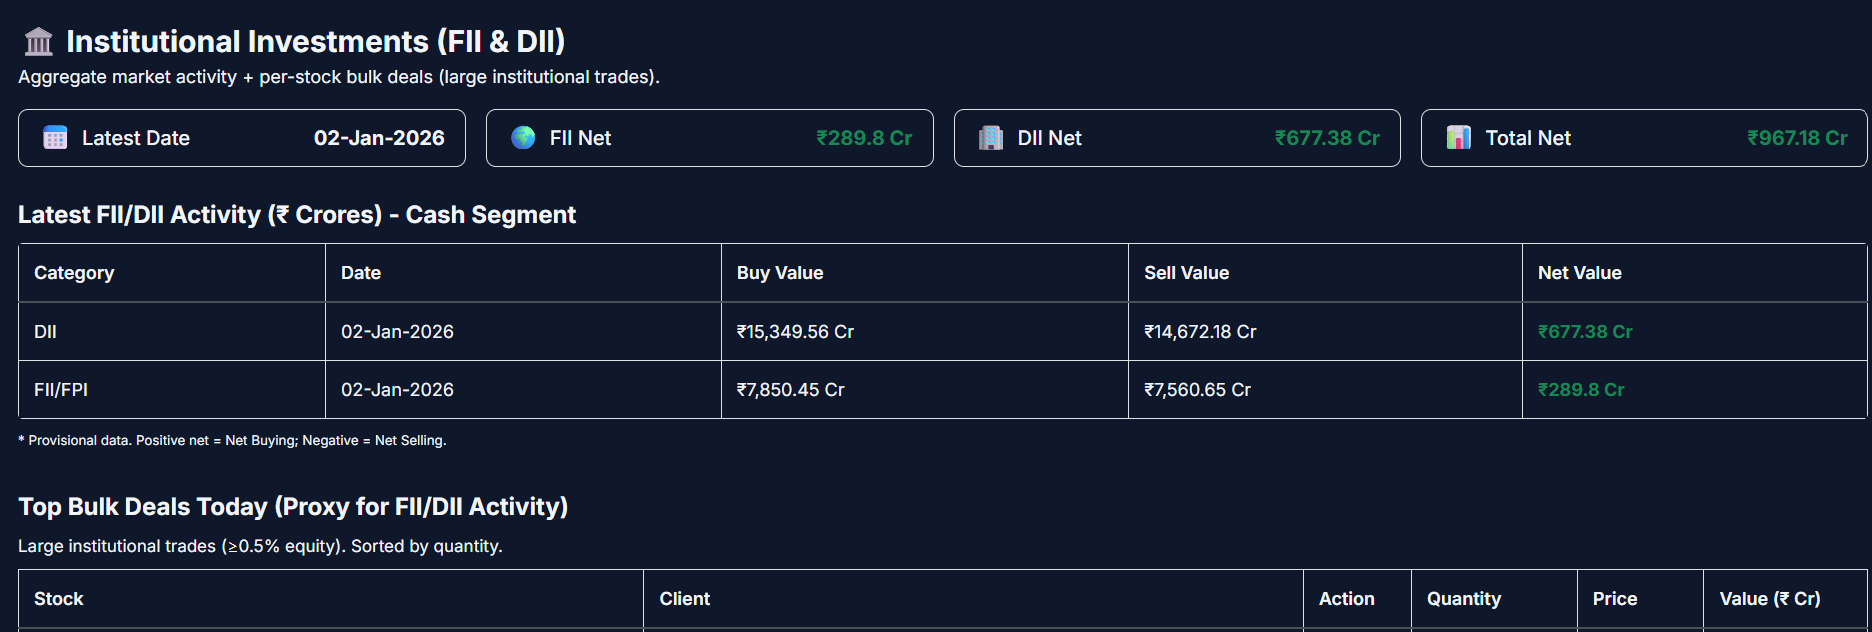
FII / DII
Track institutional money flow to read market conviction beneath the headlines. Spot accumulation, distribution, and sentiment shifts early.
Backtesting
Validate your edge before risking capital. Simulate strategies against years of historical data to uncover performance metrics, drawdowns, and reliability across market cycles.
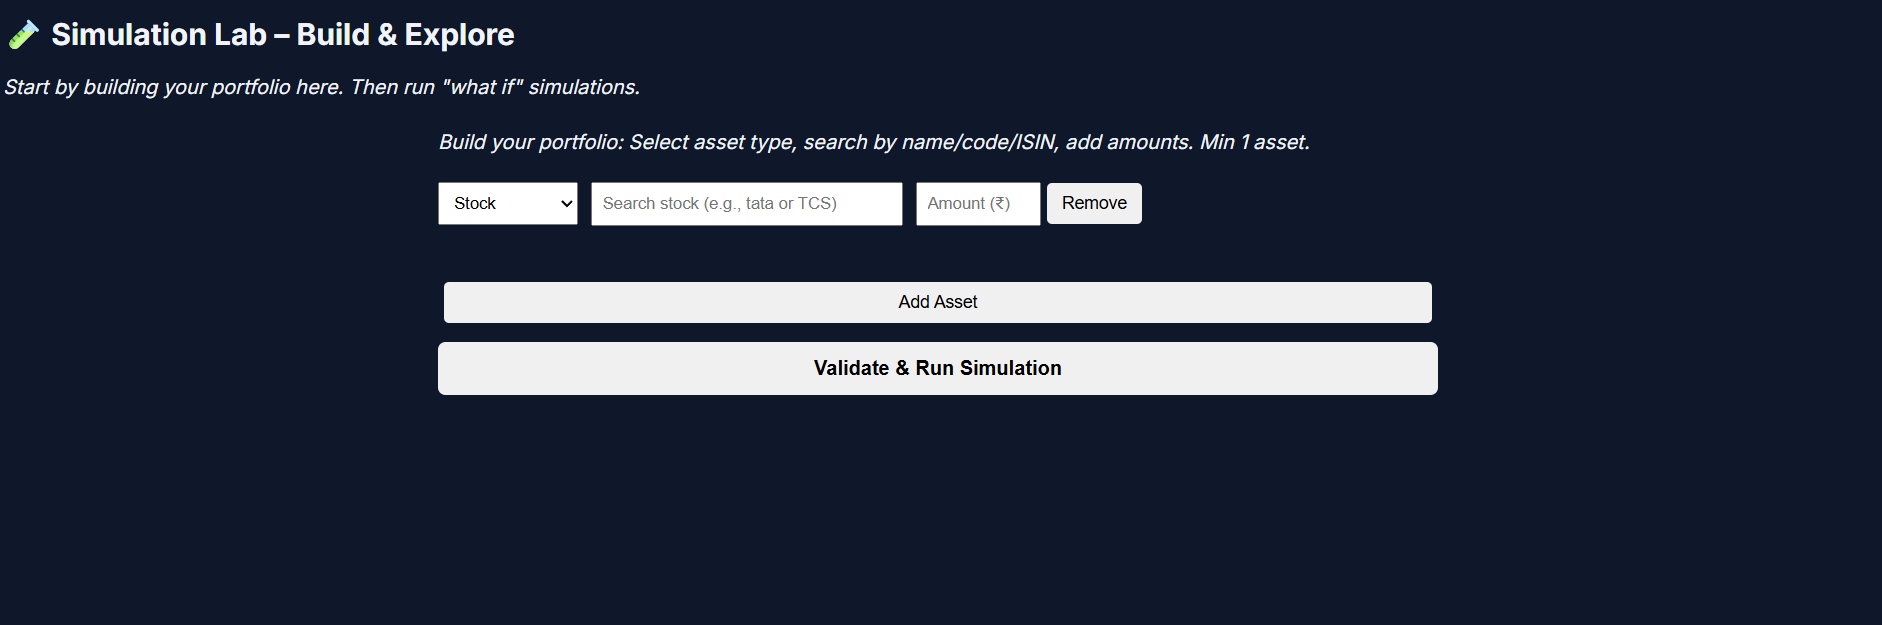
Hanuman (Simulation Lab)
Explore risk, drawdowns, and outcomes through probabilistic simulations—not predictions. Learn how portfolios behave under uncertainty.
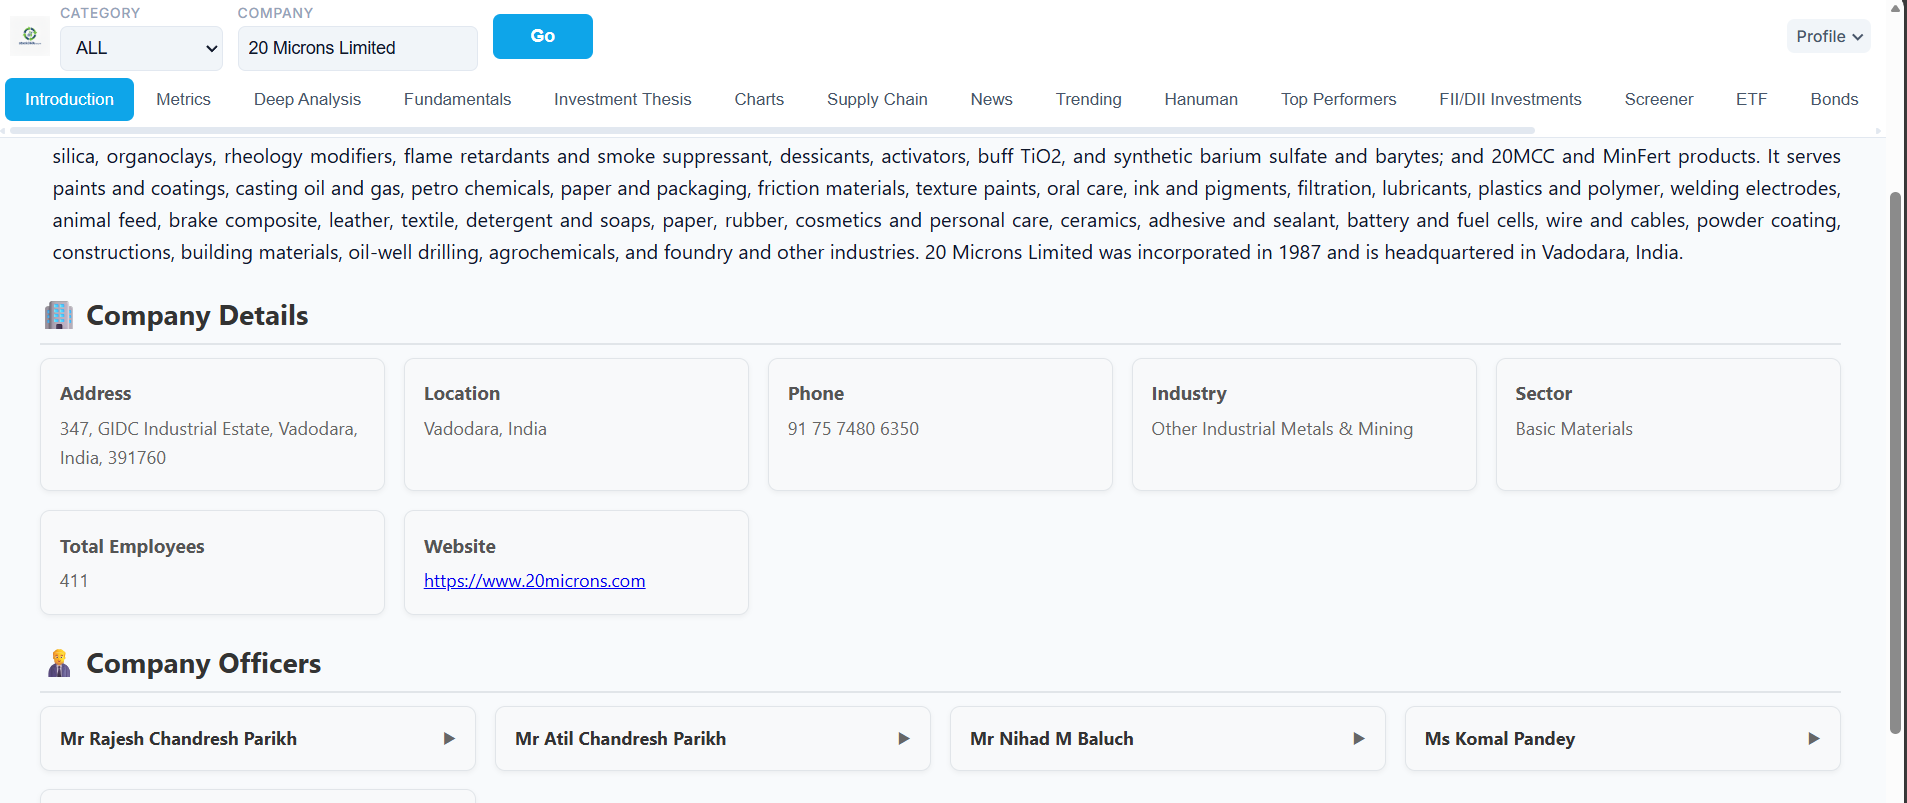
Introduction
A fast, structured snapshot of what a company does and where it stands today. The smartest place to start before going deeper.
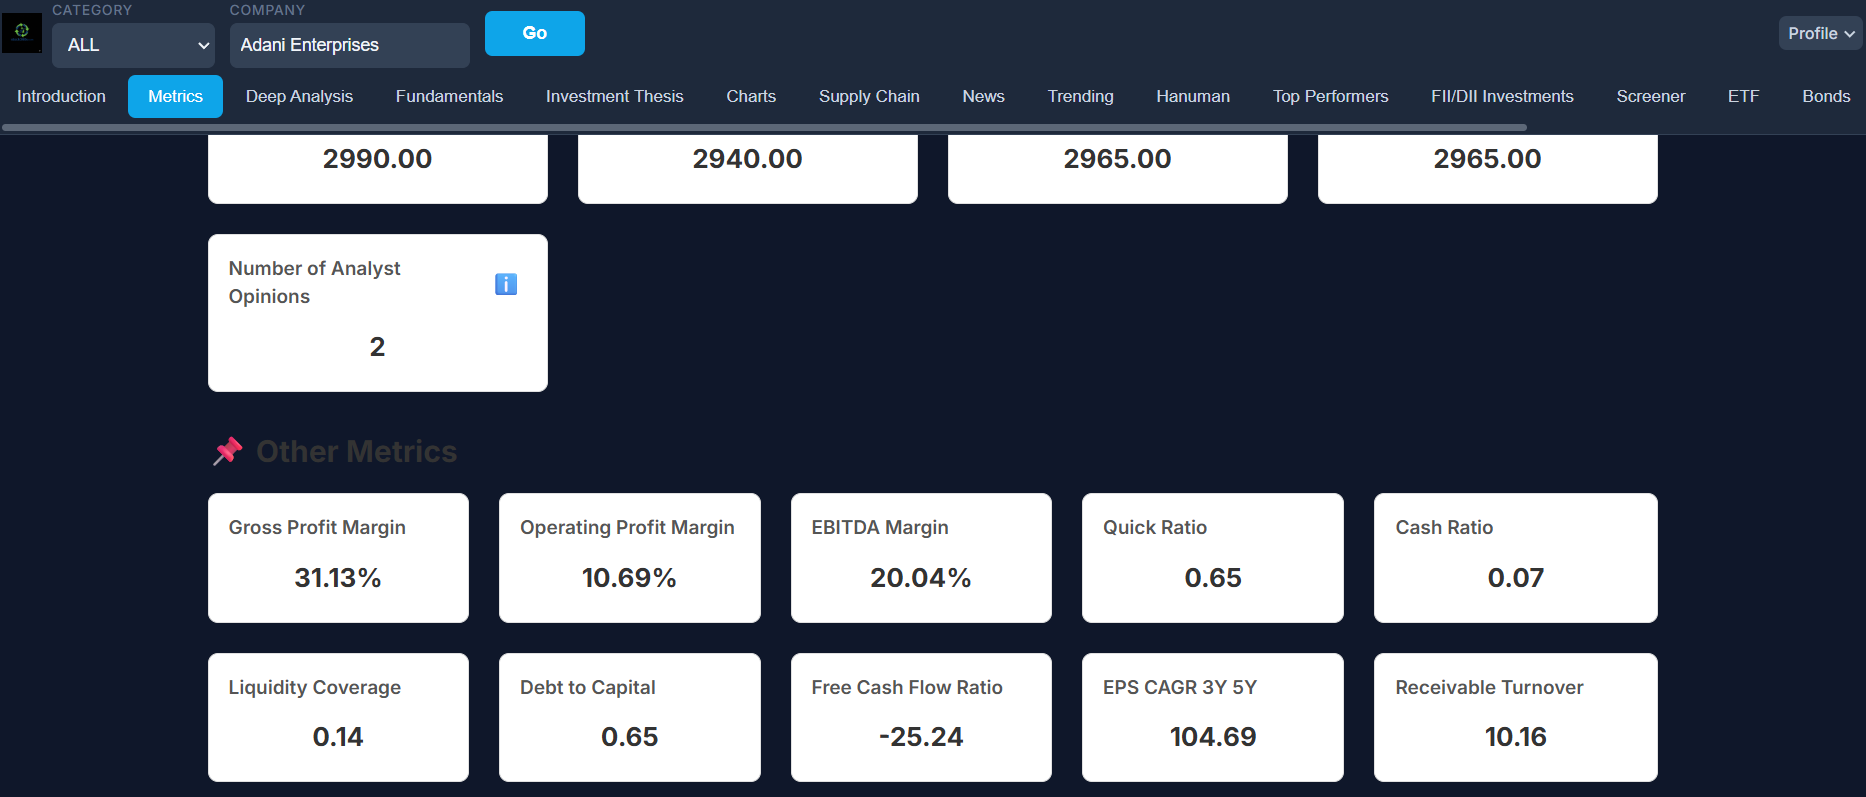
Metrics
All critical performance, risk, and valuation metrics in one coherent view. Optimized for scanning, understanding, and comparison.
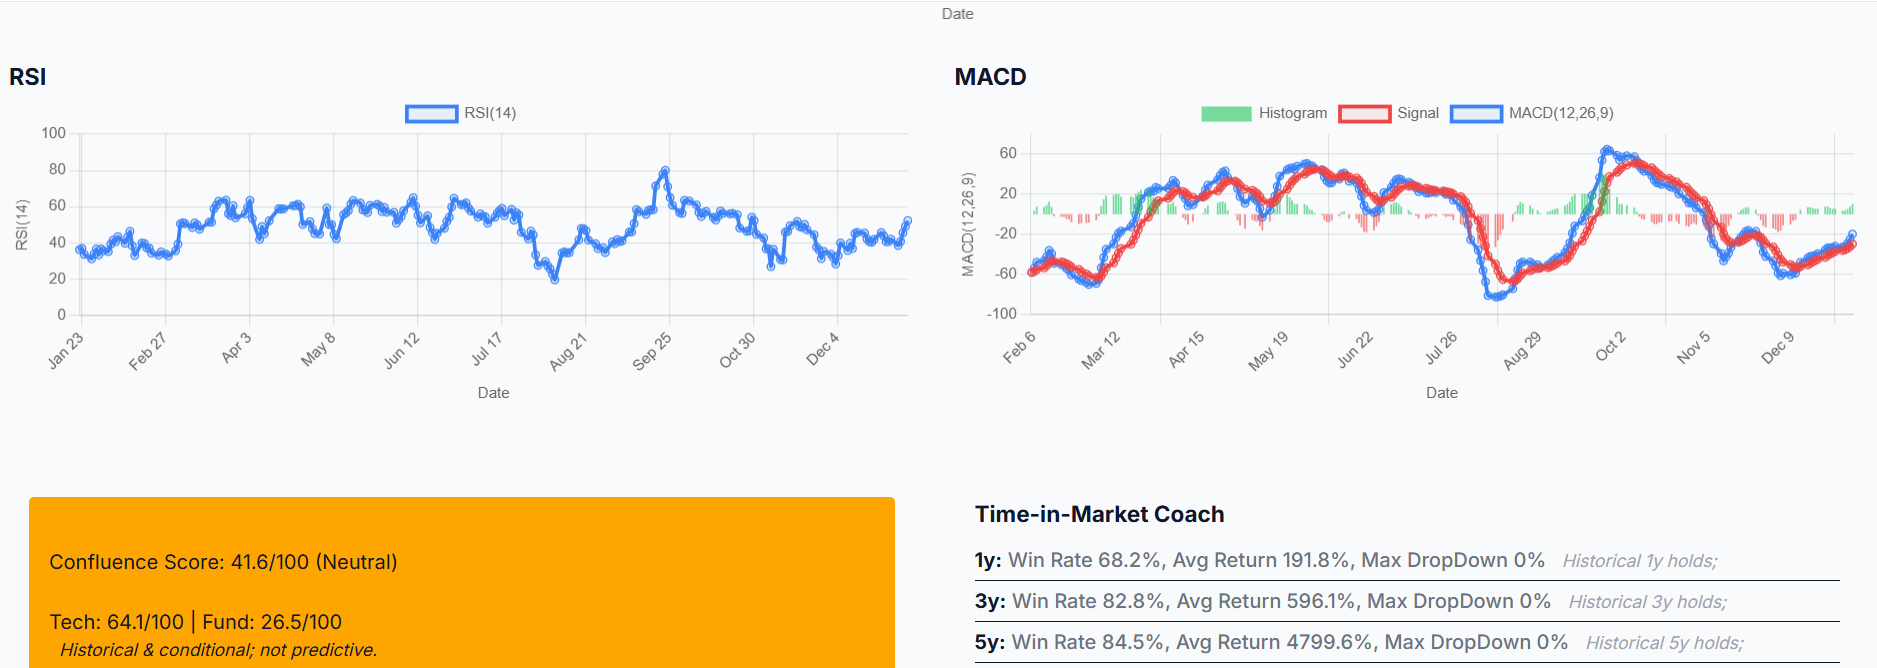
Charts
Advanced, interactive charts with technical indicators and probability-based insights. Designed for fast pattern recognition, not decorative noise.
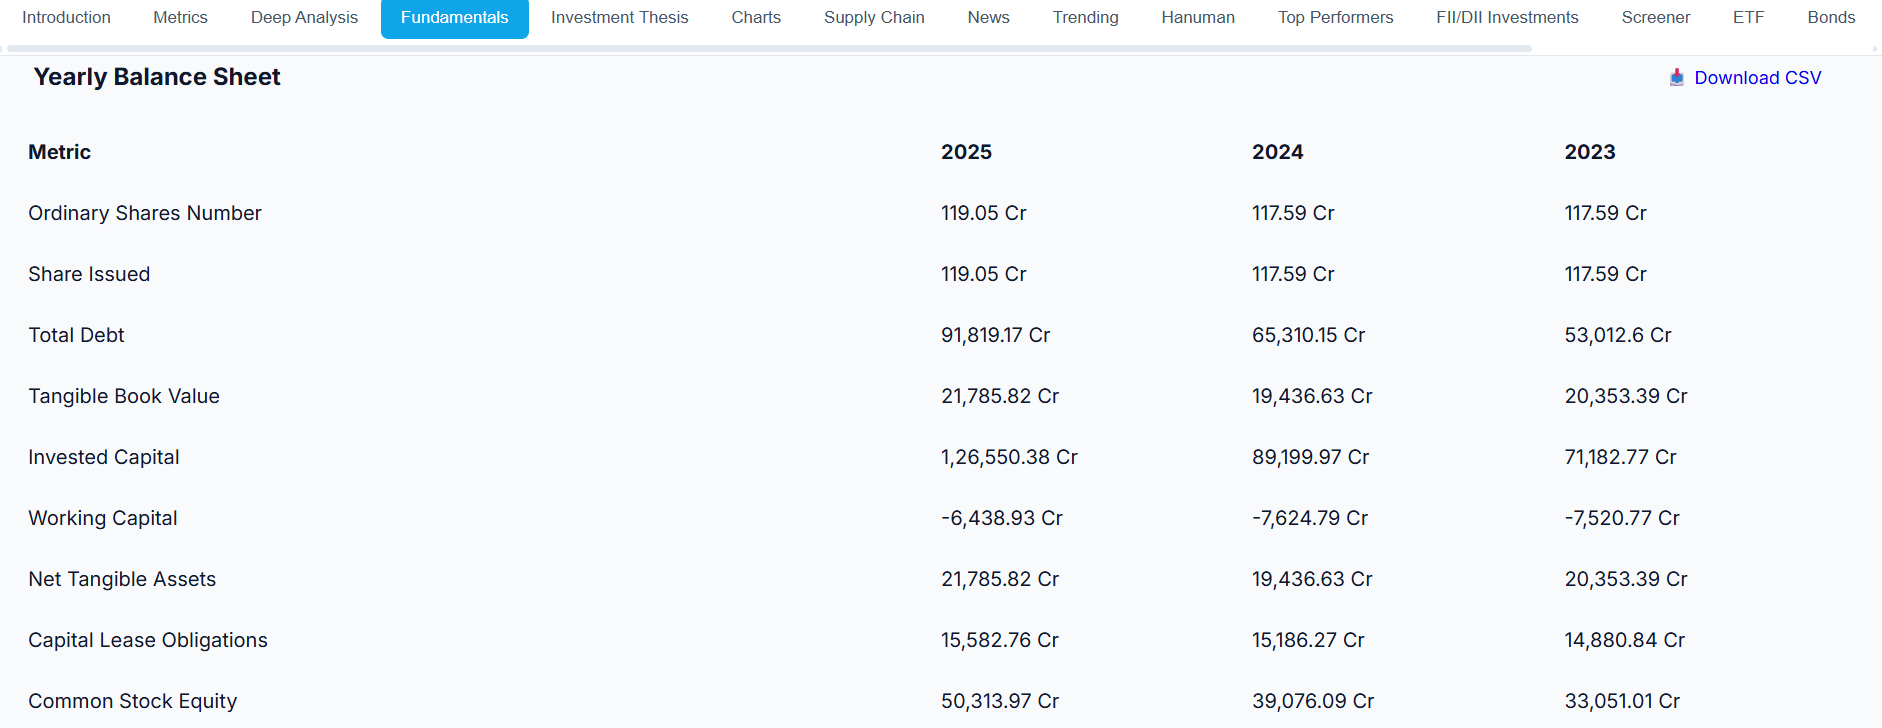
Fundamentals
Clean, multi-year financial statements built for serious long-term evaluation. Consistent formatting makes trends obvious, not hidden.
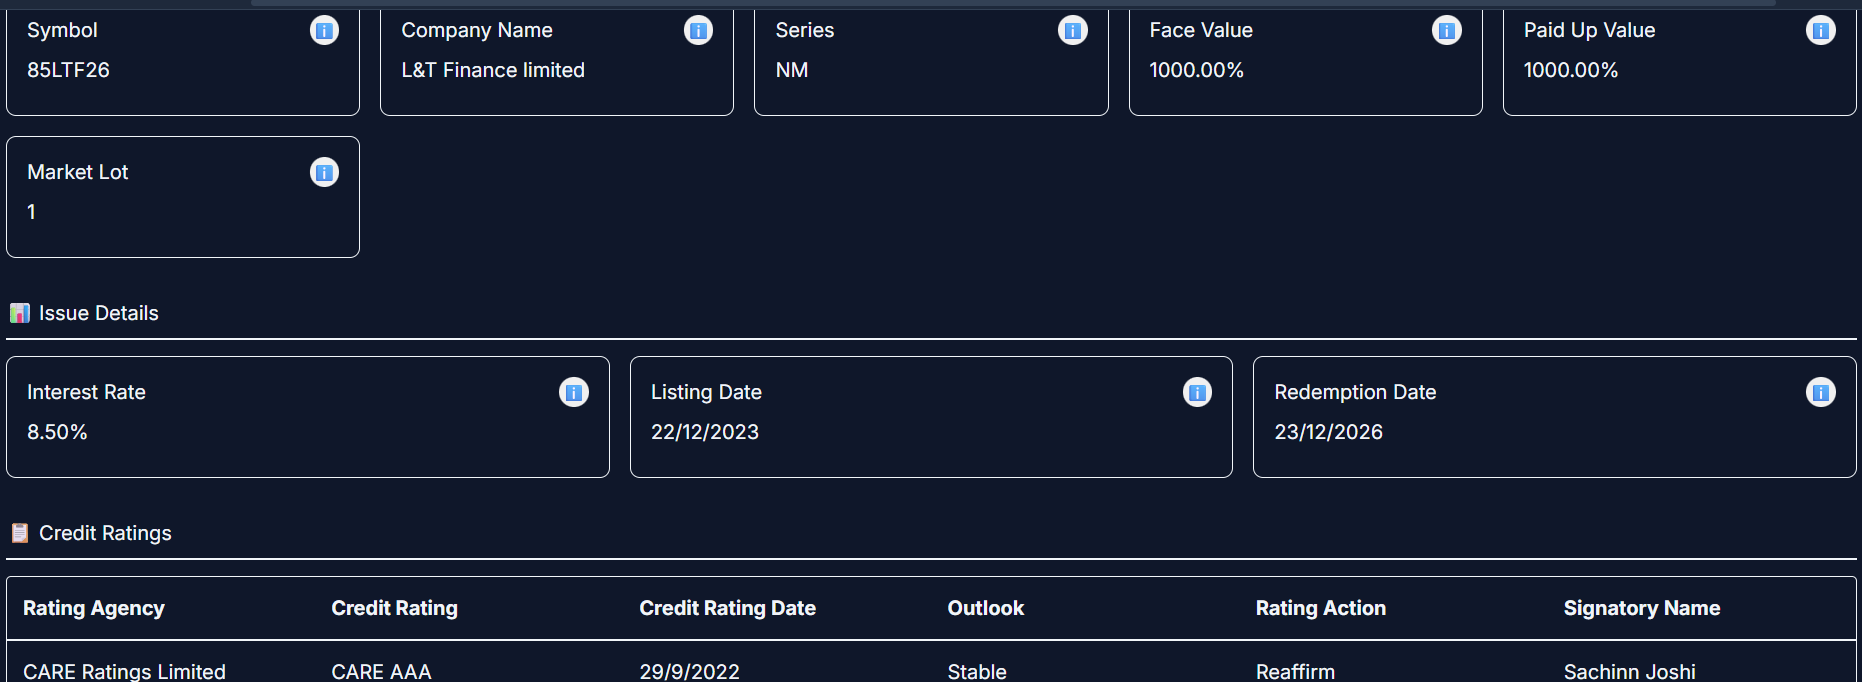
Bonds
Explore bonds from listing to maturity with clean, structured data on yields, ratings, and cash flows. Built to make fixed-income analysis precise.
ETF
Analyze ETFs by fund house or listing with instant clarity on price, liquidity, and trend strength. Everything essential, nothing buried.
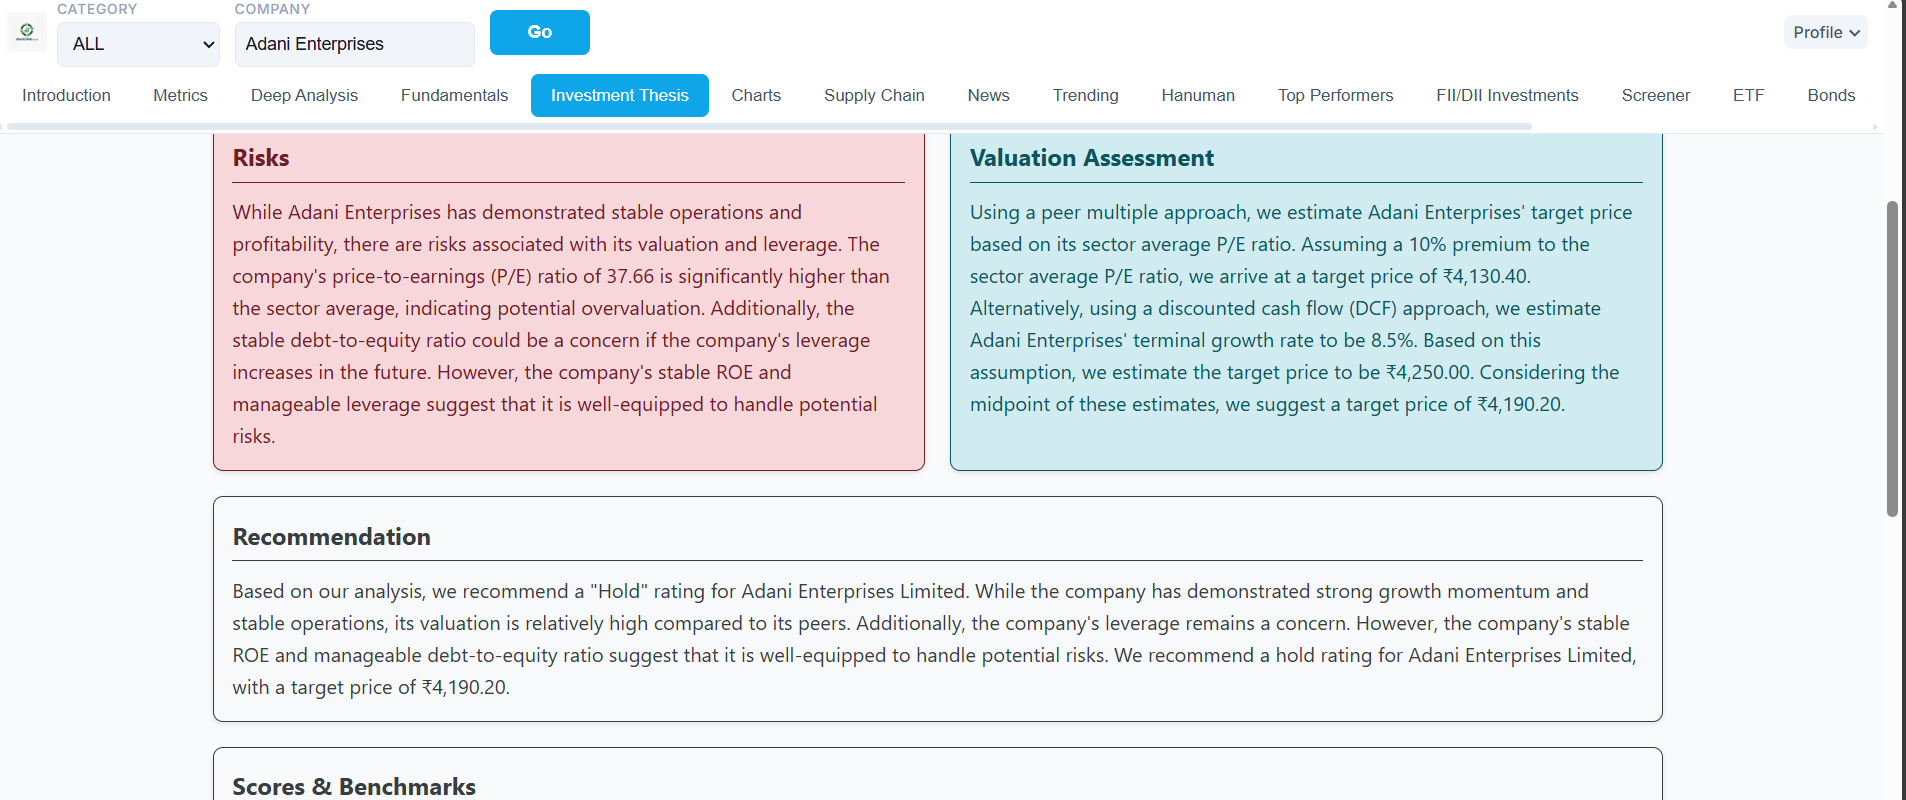
Investment Thesis
A structured narrative that connects growth, risk, valuation, and opportunity. Designed to support decisions, not just opinions.
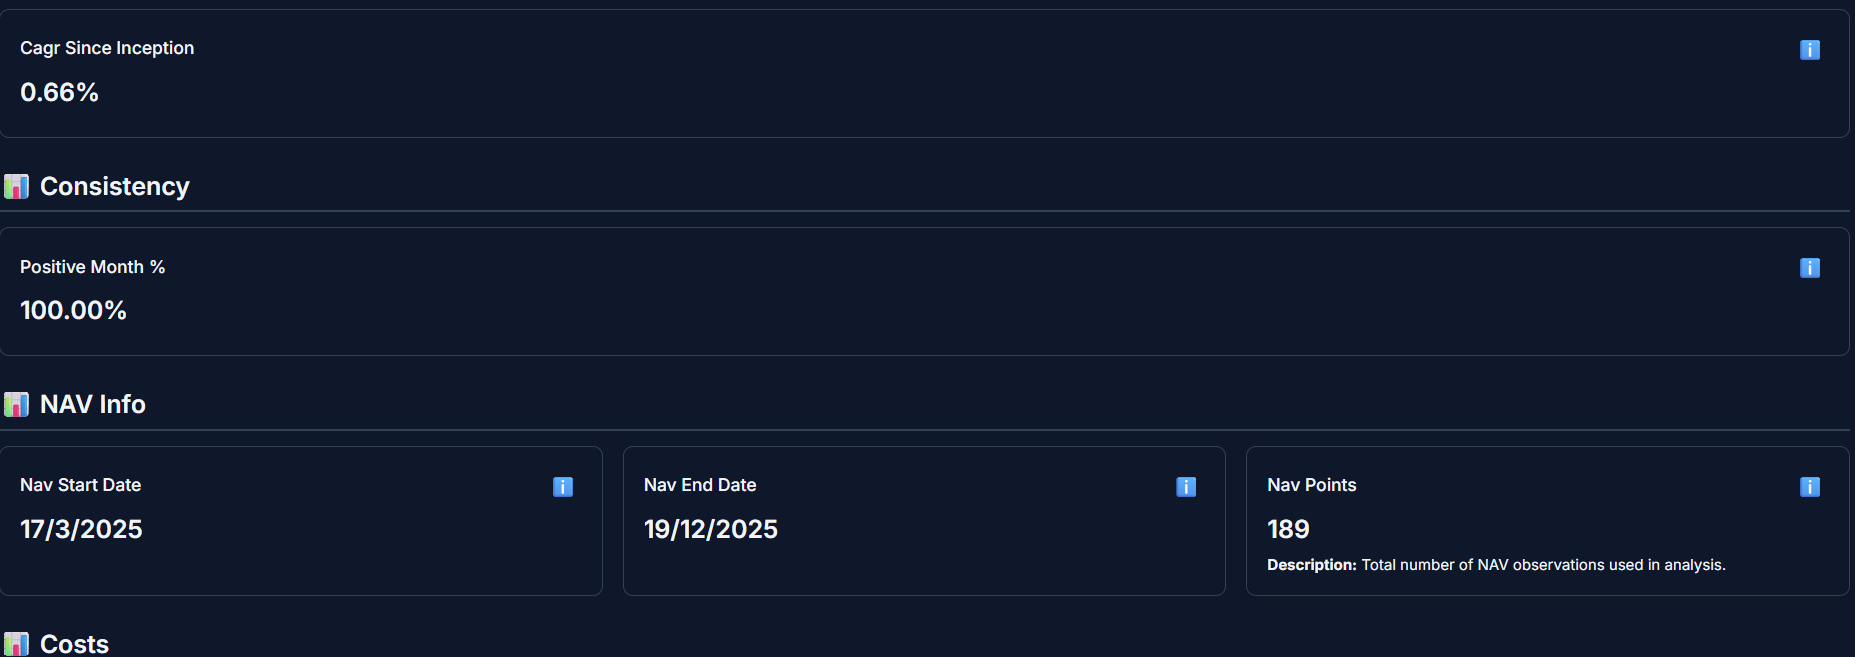
Mutual Fund
Deep-dive into returns, risk, SIP performance, and portfolio composition. Built to evaluate consistency, not just past gains.
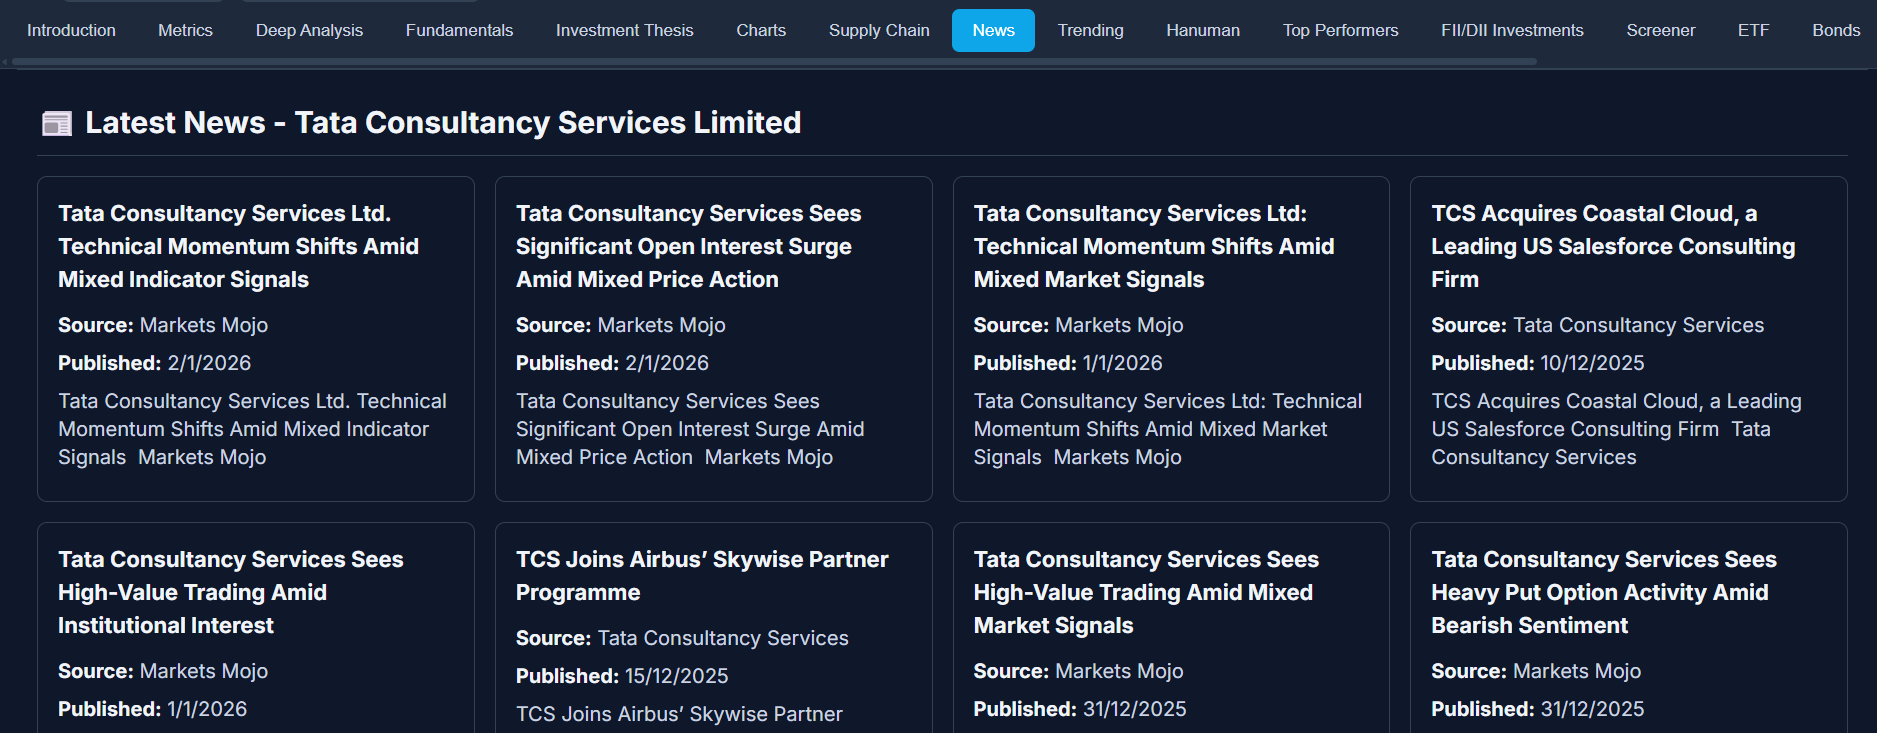
News
Stock-specific news distilled for relevance, not volume. Stay informed without breaking analytical focus.
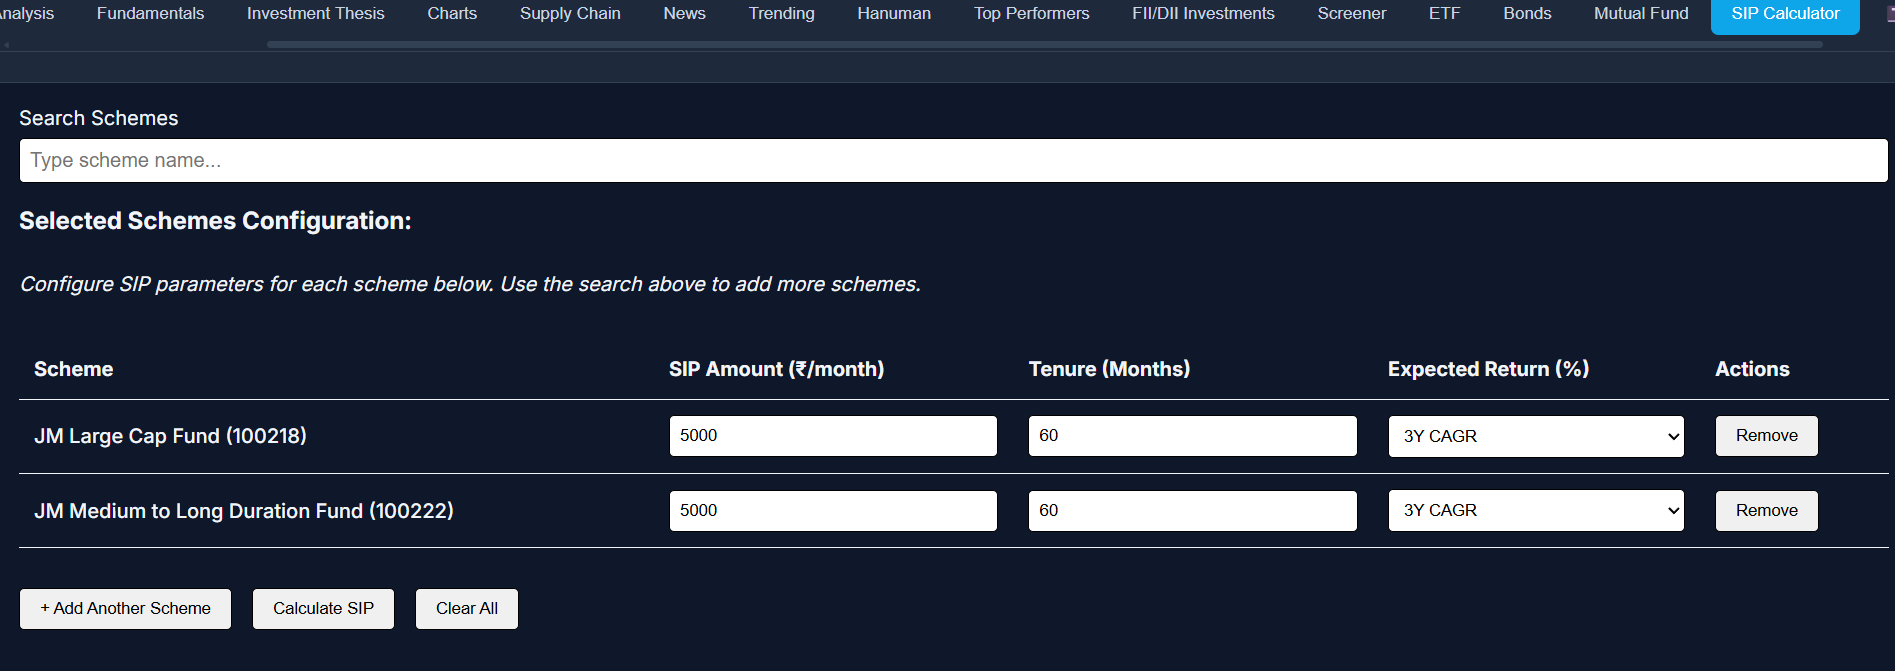
SIP Calculator
Model long-term SIP outcomes with realistic return assumptions. Clear math for disciplined, scenario-based planning.
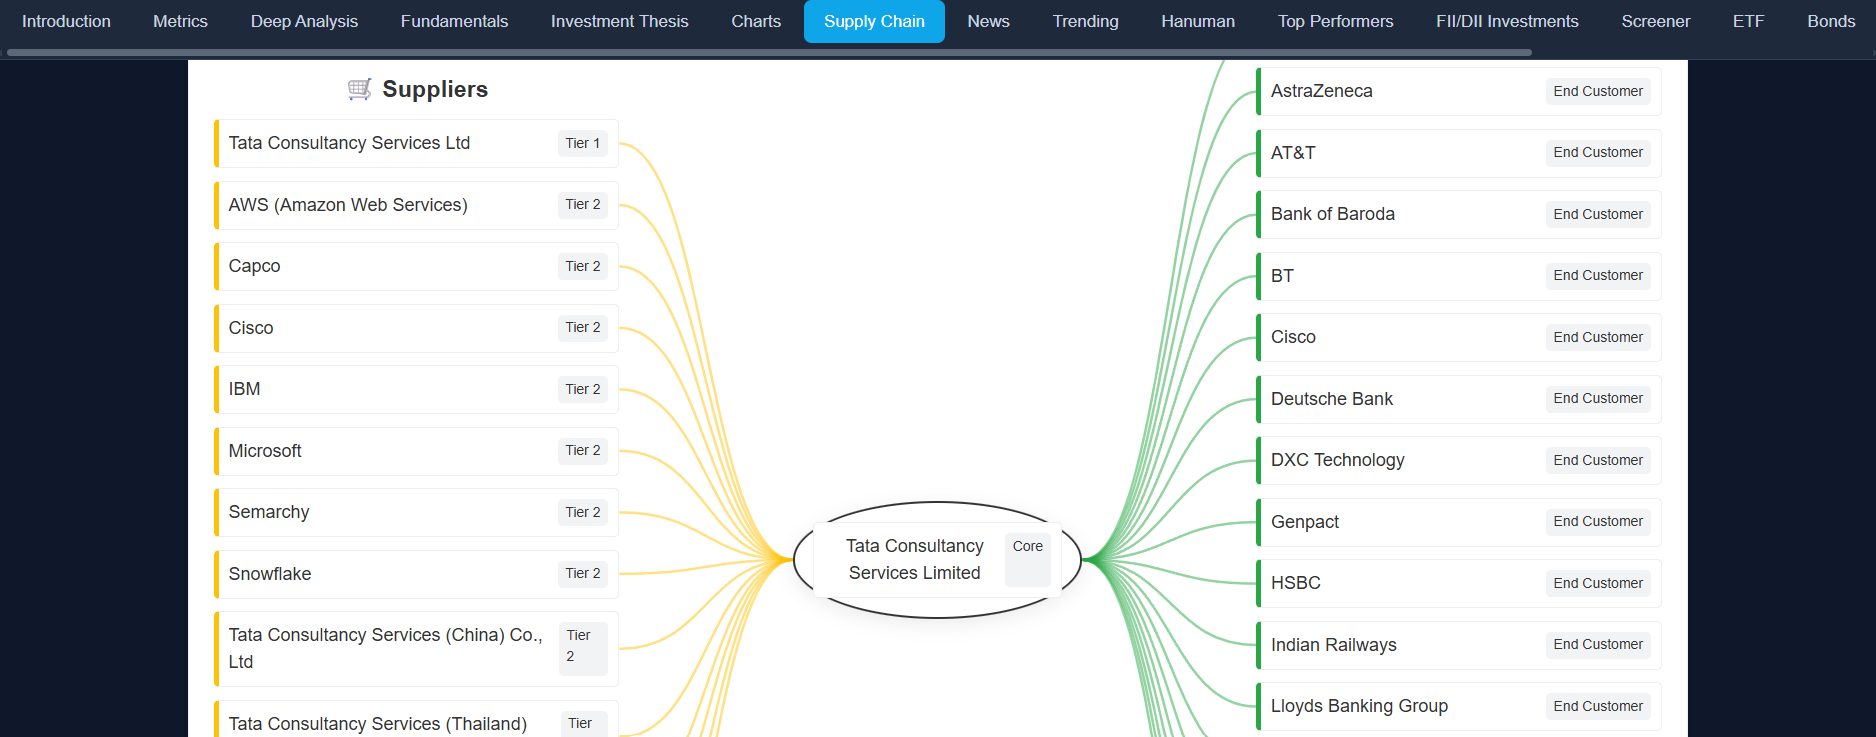
Supply Chain
Visualize dependencies, concentration risk, and hidden operational exposure. See risks that financial statements don’t reveal.
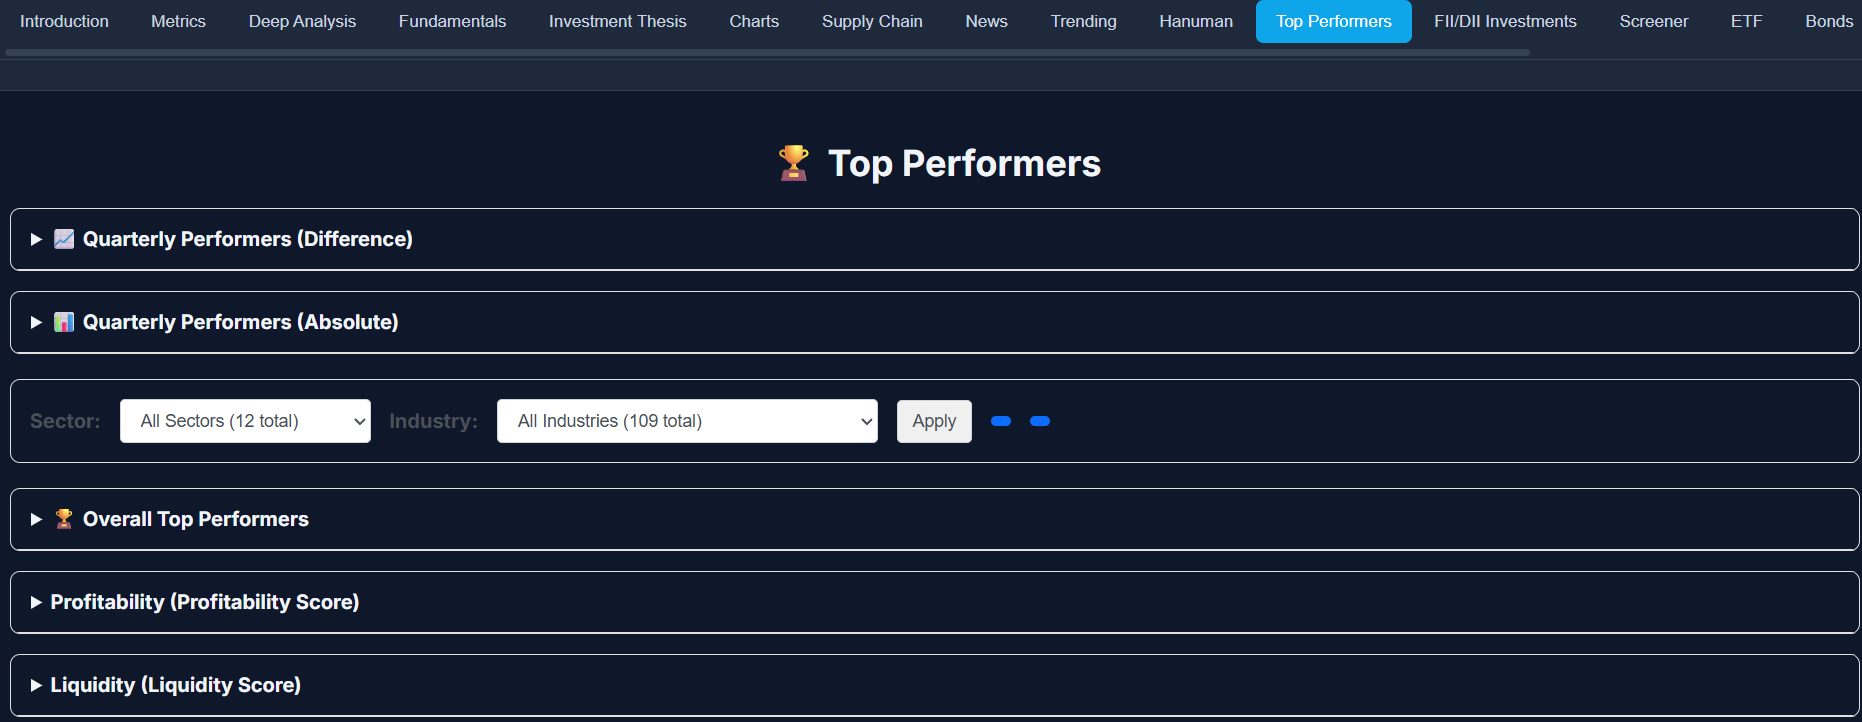
Top Performers
Identify leaders and laggards using score-driven rankings and trend shifts. Built for spotting momentum and structural strength early.
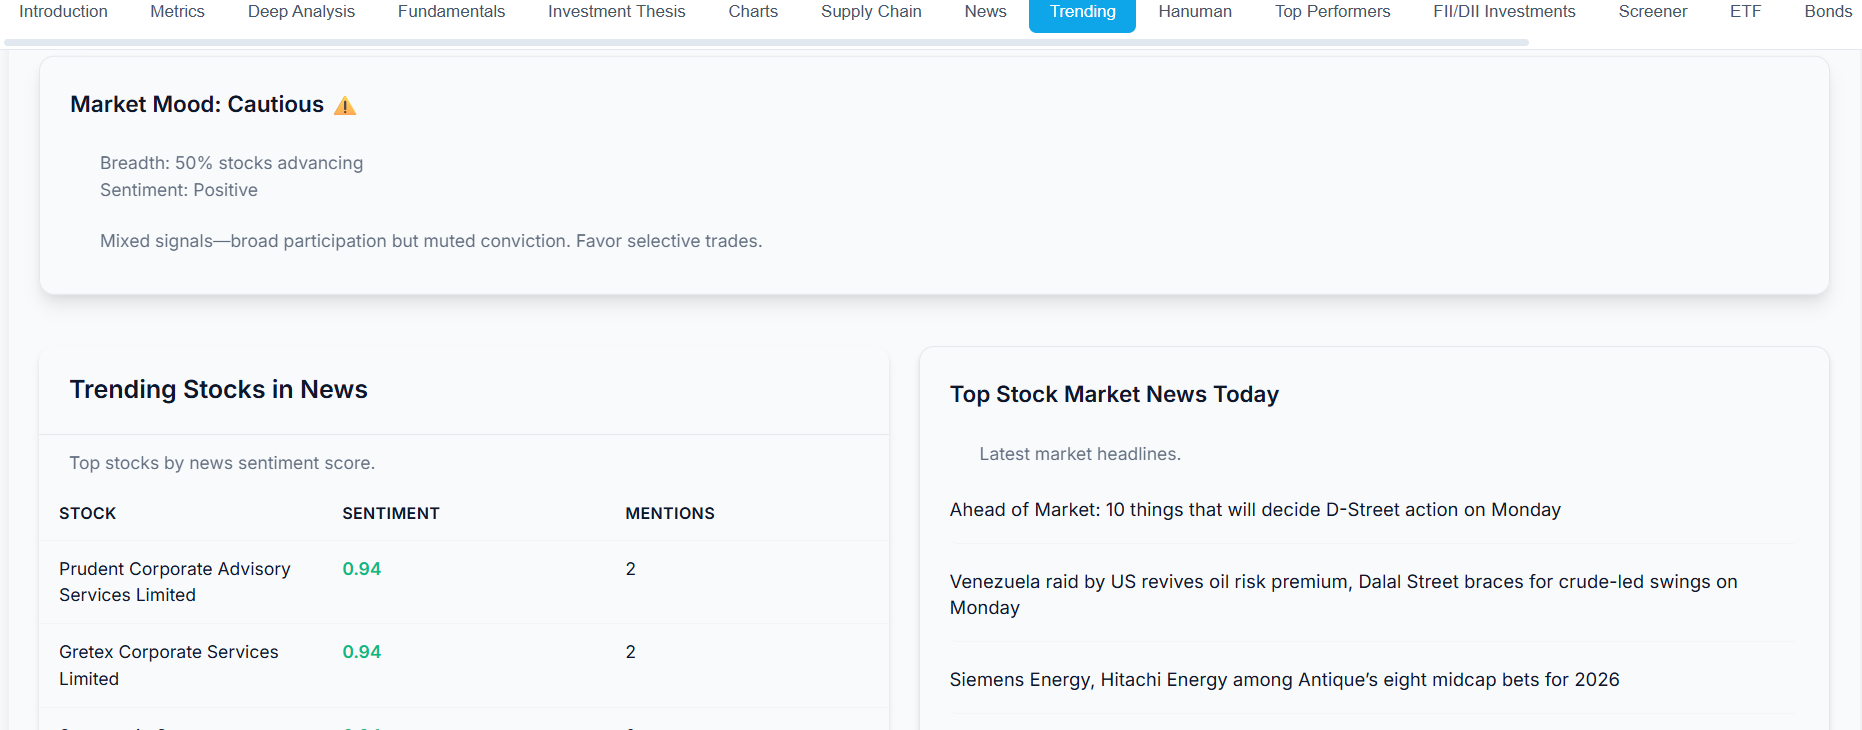
Trending
A real-time pulse of market movement, sentiment, and smart-money activity. Best for knowing what matters today.
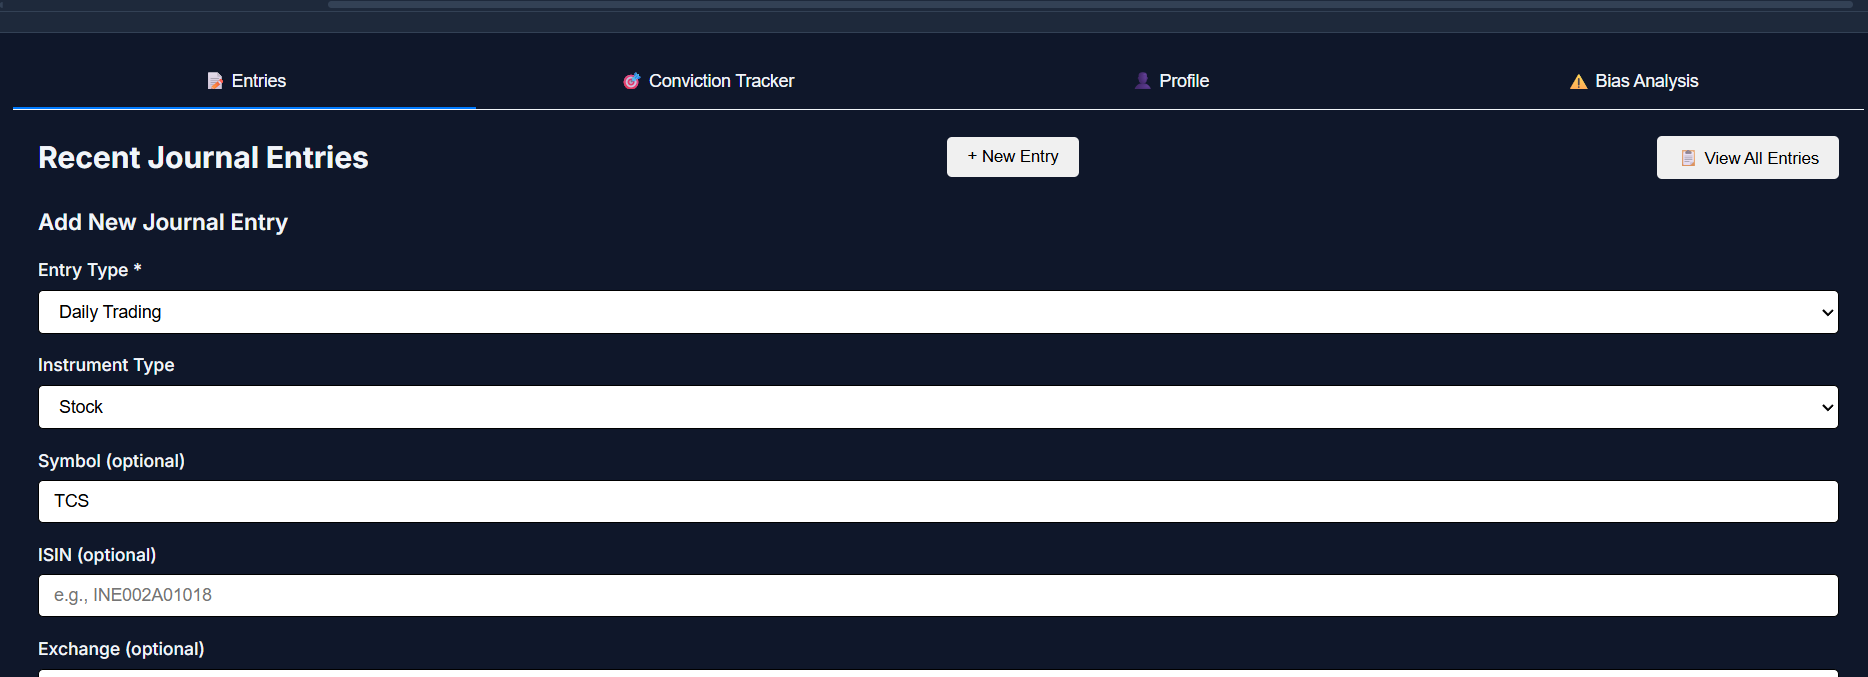
Journal
A structured decision log that turns actions and emotions into analyzable data. Learn from past decisions instead of rewriting them in hindsight.
Terminal
Your centralized command center for real-time market analysis. Monitor live feeds, and manage your workspace with institutional-grade speed and precision.
Trusted by Investors & Institutions
From individual traders to enterprise desks, see who relies on Stock 360s.
Individual Investors
"This website is amazing! It gives institution-level analytics at a very cheap price. I absolutely loved the service."
"Stock360s is amazing. It helps individual retailers to gain all the fundamentals about the stock market, and helps to take good decisions."
"I absolutely loved the ETF mode as well. I don't think any other company is providing insights on ETFs like they do."
"Terminal and Tracker are the best tabs. The trending sections keep you updated, and tracking where big institutions invest helps a lot."
Enterprise Partners
Asha Group
Enterprise Client"We recently purchased their enterprise-level subscription, and it is very helpful. The support is 24/7, and they customized the software according to our needs. Their tracker and trending features make us very fast in trading."
Simple & Transparent Pricing
Choose the plan that fits your research needs.
Starter
₹499
500 Requests/month
Growth
₹899
1000 Requests/month
Professional
₹1699
2000 Requests/month
Enterprise
₹39999
For more info contact us
Frequently Asked Questions
Everything you need to know about the platform.
What does "Request" mean in the pricing plan?
A "Request" basically means the number of companies you can select and track. For example, if your plan allows 500 requests, you can deep-dive analyze 500 different companies per month.
Can I select any company of my choice in the request?
Yes, you can select any company of your choice that is listed on the NSE (National Stock Exchange). We provide data for the entire listed universe.
Does this software contain information about bonds as well?
Yes! Stock360s is a comprehensive financial platform. We provide detailed analytics and data for Stocks, Bonds, Mutual Funds, and ETFs.
Does this software offer AI-powered analysis and market intelligence?
Yes, our model is trained specifically on financial datasets. You can expect our AI "Market Radar" and "Sentiment Analysis" to provide precise, context-aware answers regarding market trends and data.
How many days will it take for a refund?
If you are eligible for a refund according to our policy, it typically takes 6-7 working days for the amount to reflect in your original payment source.
Is the market data real-time?
Yes, our Terminal and Tracker features utilize real-time data feeds to ensure you are seeing live market movements as they happen.
Can I upgrade my plan later?
Absolutely. You can upgrade from Starter to Professional or Enterprise at any time from your dashboard settings.
Ready to Elevate Your Portfolio?
Get in touch for exclusive access or custom solutions.